


A complete guide to AI and analytics — what AI-powered analytics is, how it transforms data analysis and business intelligence, the best tools, real use cases, the ROI, and whether AI will replace data analysts.
| $785.6B Data Analytics Market by 2035 | 94% Orgs Rate BI as Critical | 23x More Likely to Win Customers | 112% Average BI ROI | 80%+ Enterprises Using Gen AI |
| Quick answer: AI and analytics means using artificial intelligence and machine learning to analyze data — automating insights, predicting outcomes, and letting anyone query data in plain language. Often called augmented analytics, it powers tools like Power BI Copilot, Tableau AI, Google Looker and ThoughtSpot, turning raw data into forecasts, anomaly alerts and recommendations without specialized SQL skills. |
Key Takeaways
- AI and analytics (augmented analytics) uses AI and machine learning to automate insights, predict outcomes and enable plain-language data queries.
- Leading AI-powered tools: Microsoft Power BI Copilot, Tableau AI, Google Looker, ThoughtSpot and Amazon QuickSight.
- The payoff is real: data-driven organizations are 23x more likely to acquire customers, and BI delivers roughly 112% average ROI.
- AI augments analysts more than it replaces them — it automates routine analysis while people handle judgment, context and decisions.
Table of Contents
1. What Is AI in Analytics?
AI and analytics is the use of artificial intelligence and machine learning to analyze data — finding patterns, predicting outcomes, and generating insights that once required a team of specialists and hours of manual work. The industry term for this convergence is augmented analytics: AI layered on top of business intelligence and data analysis to automate the heavy lifting. Instead of writing queries and building dashboards by hand, you can ask a question in plain English and get a chart, a forecast, or a recommendation in seconds.
The shift matters because data has outgrown human capacity. Organizations generate more information than any analyst can manually sift, and the bottleneck is no longer collecting data but turning it into decisions fast enough to act on. AI removes that bottleneck by automating pattern detection, surfacing anomalies before anyone notices them, and translating complex results into plain language. This is one of the highest-value applications of generative AI in business, and it sits at the heart of the modern data stack.
It is worth distinguishing the related terms you will encounter. Data analysis is the broad practice of examining data to draw conclusions; business intelligence (BI) is the tooling and processes that turn data into dashboards and reports for decision-making; and AI analytics is the AI-powered evolution of both. Our guides on BI and AI and using AI for data analysis dig into each. Throughout this guide, “AI and analytics” refers to the whole field of applying AI to data work.
The change is best understood as a lowering of barriers. For decades, getting an answer from your data meant going through a specialist — an analyst who could write the query, build the report, and interpret the result — which made analysis slow, expensive and rationed. AI collapses that chain. A manager can now ask a question directly, get a chart and a forecast in seconds, and act on it the same day, while the analyst is freed to tackle the harder, more strategic questions. This is not a marginal efficiency gain; it is a structural shift in who can use data and how fast organizations can react, and it is why every major software vendor is racing to embed AI into its analytics products.
2. How AI Is Transforming Data Analytics
AI changes analytics in four concrete ways. First, natural-language querying lets anyone ask questions in plain English — “which regions grew fastest last quarter?” — and get instant answers, charts and forecasts, largely bypassing the need for SQL or specialized BI skills. This democratizes data, putting analysis in the hands of marketers, managers and founders, not just analysts. Second, automation handles the repetitive grind: cleaning data, building reports, refreshing dashboards and writing summaries that used to consume an analyst’s day.
Third, AI moves analytics from looking backward to looking forward. Traditional BI describes what happened; AI adds predictive analytics (what is likely to happen) and prescriptive analytics (what to do about it), forecasting sales, churn and demand and explaining the factors behind each prediction. Fourth, AI provides continuous, automated monitoring — augmented analytics acts like a data scientist working around the clock, detecting anomalies, spotting patterns and flagging opportunities that would take a human days to find. Together these turn analytics from a periodic report into a live, proactive system.
The newest frontier is agentic analytics: AI systems that do not just answer one question but handle whole data tasks, collaborating like human analysts to manage multi-step projects without constant tool-switching. Powered by advanced reasoning models — the kind covered in our best AI models guide — these agents can investigate a trend, pull related data, run the analysis and draft the conclusions autonomously. This is where analytics is heading: from self-service dashboards to AI colleagues that own analytical workflows end to end.
Underpinning all of this is a quieter but important shift in the data stack itself. Modern cloud data warehouses and lakehouses now embed AI directly where the data lives, so analysis happens without exporting data to separate tools, and natural-language interfaces sit on top of governed semantic layers that ensure everyone’s “revenue” means the same thing. This matters because the value of AI analytics depends entirely on the data beneath it: a well-governed, unified data foundation lets AI deliver trustworthy answers, while a fragmented one produces contradictions. The organizations seeing the biggest gains are the ones that invested in clean, consolidated data first, then layered AI on top — not the reverse.
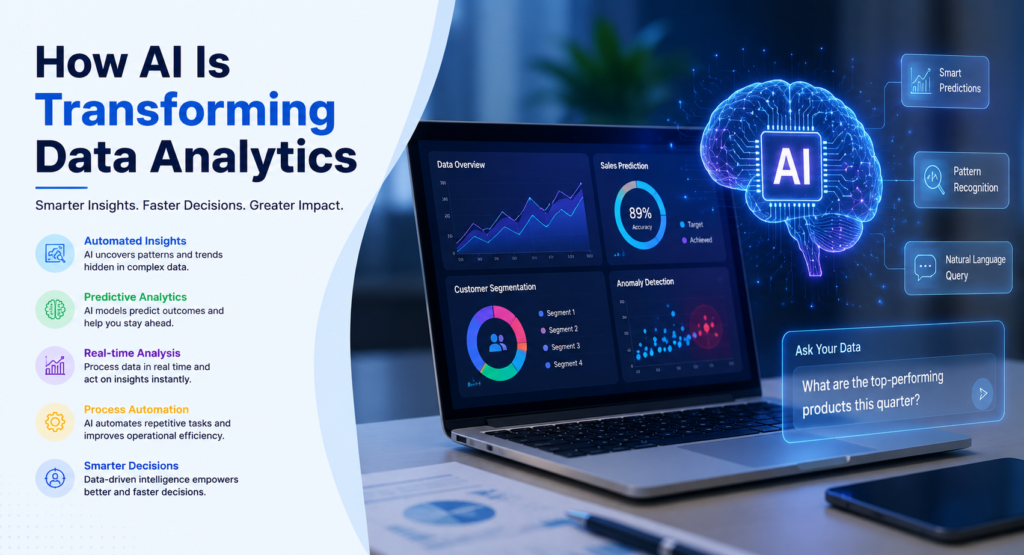
Figure 3: How AI moves analytics from descriptive to predictive and prescriptive
3. The Best AI Analytics & BI Tools
Every major BI platform now embeds AI, and a wave of AI-native tools has joined them. Here are the leaders.
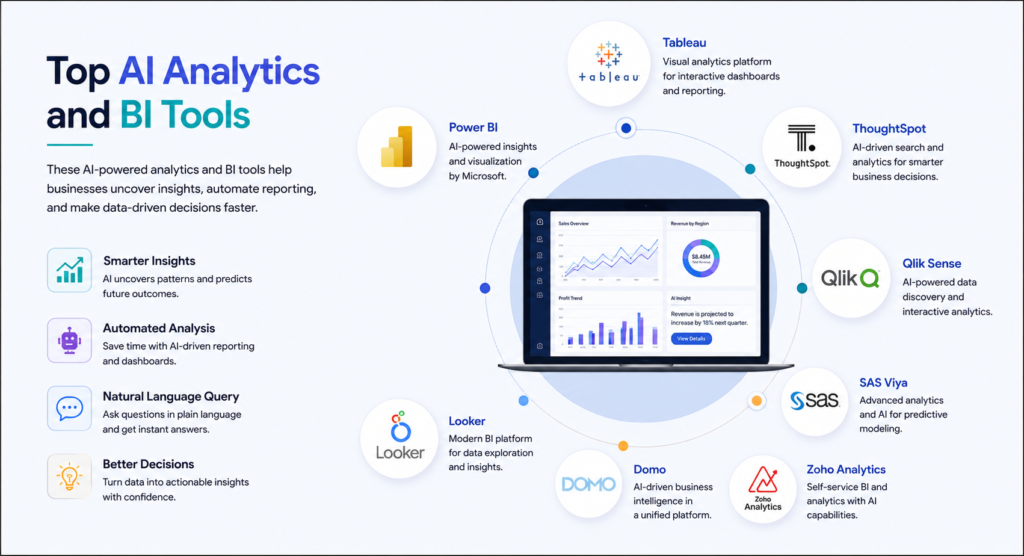
Figure 2: The leading AI-powered analytics and BI tools
| Tool | AI Capability | Best For |
|---|---|---|
| Microsoft Power BI (Copilot) | Natural-language Q&A, auto-insights, report generation | Microsoft 365 organizations |
| Tableau (Tableau AI / Pulse) | AI-driven insights, natural-language, proactive alerts | Visual analytics & enterprises |
| Google Looker (Gemini) | Conversational analytics, AI modeling | Google Cloud & data teams |
| ThoughtSpot | Search-and-AI natural-language analytics | Self-service, non-technical users |
| Amazon QuickSight / Quick Suite | AI-driven analytics & BI on AWS | AWS-based organizations |
| Julius AI / Polymer | AI chat over spreadsheets & CSVs | Quick analysis without setup |
| Qlik / Domo / Sisense | Augmented analytics & embedded AI | Enterprise data platforms |
The incumbents lead through integration. Microsoft Power BI with Copilot lets users build reports and ask questions in natural language inside the Microsoft ecosystem; Tableau‘s AI features and Pulse deliver proactive, plain-language insights; and Google Looker, powered by Gemini, brings conversational analytics to Google Cloud. For teams that want search-style simplicity, ThoughtSpot pioneered letting anyone type a question and get an answer. And lightweight AI-native tools like Julius AI let you upload a spreadsheet and simply chat with your data. For a deeper, category-by-category breakdown, see our roundup of the AI tools for data analysis and the picks tailored to business analysts.
Choosing among them comes down to a few practical questions rather than feature checklists. The most important is which ecosystem you already live in: if your data and team are on Microsoft, Power BI’s Copilot is the path of least resistance; on Google Cloud, Looker with Gemini fits naturally; on AWS, QuickSight. The second question is who will use it — search-style tools like ThoughtSpot and chat-with-your-data tools like Julius AI lower the barrier for non-technical staff, while Tableau and Power BI reward dedicated analysts with deeper control. The third is data scale and governance needs, where enterprise platforms like Qlik, Domo and Sisense earn their keep. Start from where your data already lives, and you will usually find the AI features waiting there.
| 💡 Pro Tip Before buying a new AI analytics platform, check what your current BI tool already offers — Power BI, Tableau and Looker have all added powerful AI features you may already be paying for. Turning on Copilot or Tableau AI is often faster and cheaper than migrating to a new tool, and it keeps your data and dashboards in one place. |
4. AI Analytics Use Cases
AI analytics delivers value across the full spectrum of data work. The clearest pattern is the move up the “analytics maturity” ladder — from describing the past to predicting and prescribing the future.
| Type | Question it answers | Example |
|---|---|---|
| Descriptive | What happened? | Automated dashboards & summaries |
| Diagnostic | Why did it happen? | Root-cause & anomaly detection |
| Predictive | What will happen? | Sales, churn & demand forecasting |
| Prescriptive | What should we do? | AI-recommended next actions |
Beyond the ladder, specific applications stand out. Forecasting predicts sales, demand and revenue while explaining the drivers behind each number. Anomaly detection flags fraud, outages or unusual spending in real time. Customer analytics segments audiences and predicts churn. And sentiment analysis uses AI to read the emotion in reviews, support tickets and social posts at scale — a high-value use case we cover in depth in our guide to AI sentiment analysis. For the largest datasets, AI is also what makes big data tractable, finding signal in volumes no human could review.
These use cases apply across every function. Marketing uses AI analytics to optimize spend and predict campaign performance; finance for forecasting and risk; operations for demand planning and anomaly alerts; product for usage analysis; and HR for attrition prediction. The common thread is turning a flood of data into a specific, timely recommendation — which is exactly the value that drives the technology’s rapid adoption.
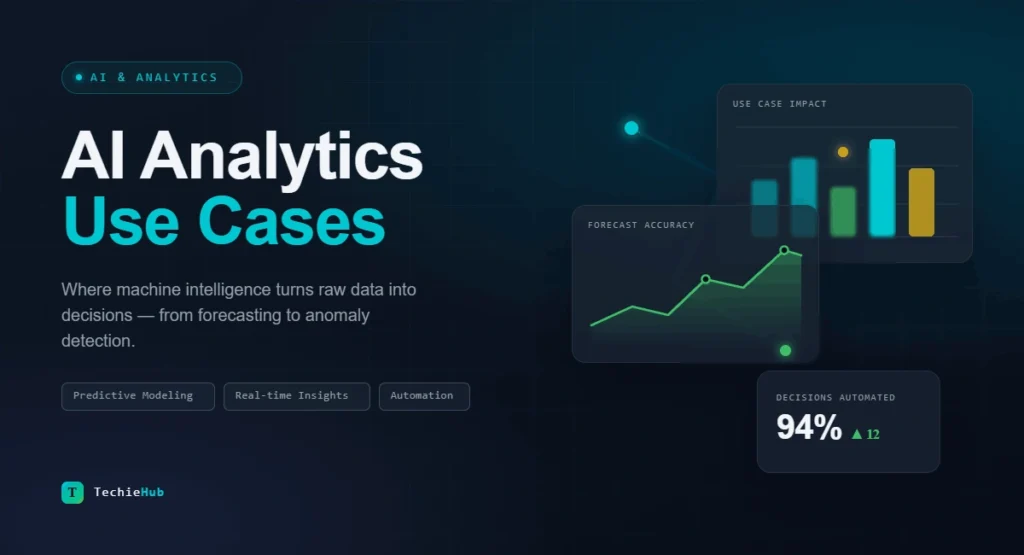
Figure 4: Common AI analytics use cases across business functions
5. AI Analytics vs Traditional BI
The difference between traditional BI and AI-powered analytics is the difference between a rear-view mirror and a co-pilot. Traditional BI is excellent at reporting what happened — dashboards, scheduled reports, historical trends — but it is reactive, requires technical skill to query, and leaves the interpretation to you. AI analytics is proactive: it surfaces insights you did not think to ask for, lets non-technical users query in plain language, predicts what comes next, and explains its findings automatically.
| Dimension | Traditional BI | AI Analytics |
|---|---|---|
| Orientation | Backward-looking | Forward-looking & proactive |
| Access | Needs SQL / analyst skills | Plain-language queries |
| Insight discovery | You ask, it answers | It surfaces insights automatically |
| Output | Dashboards & reports | Forecasts, alerts, recommendations |
| Speed | Hours to days | Seconds to minutes |
The practical reality is that the two are merging rather than competing. Every major BI platform is bolting AI onto its core, so “AI analytics” is fast becoming simply “analytics.” The dimension where AI changes the game most for everyday users is access — by removing the technical barrier, it turns data analysis from a specialist service into something any employee can do, which is the real democratization story behind AI in business analytics. For most organizations, then, the question is no longer “BI or AI analytics?” but “how fast can we turn on the AI features in the tools we already run, and govern them well?” — a far easier and cheaper path than the rip-and-replace migration the framing of “AI versus BI” might suggest.
6. The Benefits & ROI of AI Analytics
The business case for data-driven decision-making is well documented, and AI amplifies it. Data-driven organizations are 23 times more likely to acquire customers, six times more likely to retain them, and 19 times more likely to be profitable than their peers (McKinsey). Companies using business intelligence report an average ROI of around 112% with a payback period under two years (Nucleus Research), and organizations with high BI adoption are five times more likely to make faster, better-informed decisions (Aberdeen Group). AI extends every one of those advantages by making analysis faster, cheaper and accessible to more people.
The market reflects this value. The data analytics market is growing from roughly $64.75 billion in 2025 toward $785.6 billion by 2035, and the business intelligence segment continues to expand at double-digit rates. Crucially, 94% of organizations rate BI and analytics as critical or very important to their success, and the vast majority of enterprises are now deploying generative AI in their workflows. The concrete benefits are speed (insights in seconds, not days), accessibility (anyone can query data), foresight (predictions, not just history), and scale (analyzing volumes no team could handle manually) — and together they explain why adoption has moved from experiment to standard practice.
The cost side of the equation has improved just as dramatically. Because AI features are increasingly bundled into BI platforms organizations already license, much of the value arrives without a separate purchase, and natural-language interfaces cut the hidden cost of analyst time spent fielding routine requests. AI also shortens the path from question to decision, and faster decisions compound — a retailer that spots a demand shift days earlier, or a finance team that catches an anomaly in real time, captures value that never shows up on a software invoice. When evaluating ROI, the smartest teams look beyond licensing cost to these second-order gains: reduced analyst backlog, faster reaction times, and decisions made by more people with better information. Measured that way, well-implemented AI analytics is one of the highest-return investments in the modern data stack.
| ⚠️ Important AI analytics is only as good as the data behind it. Poor data quality, inconsistent definitions and ungoverned sources produce confident but wrong insights — and AI can scale those errors faster than any human. Invest in clean, well-governed data first; an AI layer on top of messy data amplifies the mess rather than fixing it. |
7. Will AI Replace Data Analysts?
This is the question on every analyst’s mind, and the honest answer is nuanced: AI is automating large parts of the analyst’s job, but it is not replacing the analyst. The routine work — pulling data, cleaning it, building standard reports, writing summaries — is increasingly automated, and natural-language tools let non-analysts answer their own basic questions. That genuinely reduces demand for purely technical, report-building roles.
But the parts that matter most remain human. Deciding which questions to ask, understanding business context, judging whether an AI’s answer is trustworthy, communicating insight persuasively to leadership, and connecting analysis to decisions all require judgment that AI does not have. The analyst’s role is shifting from producing analysis to directing and validating it — becoming a translator between data, AI and the business. Analysts who learn to wield AI tools will be far more productive and valuable; those who only do what AI now automates are most exposed. We explore this in depth in our guides to whether AI will take over data analytics and the rise of the data analyst AI. The consistent takeaway: AI changes the job rather than ending it.
History supports this reading. Self-service BI tools were supposed to eliminate analysts a decade ago; instead, easier access created more demand for data work, because every answer raised new questions and someone had to govern, interpret and act on the flood of insight. AI is likely to follow the same pattern at a larger scale — automating the routine, raising expectations, and increasing the strategic value of people who can turn data into decisions. The practical advice for analysts is therefore not to fear the technology but to adopt it aggressively: learn the AI tools, move up the value chain toward interpretation and strategy, and become the person who makes AI-driven analytics trustworthy and actionable for the rest of the organization.
8. Challenges & Limitations
AI analytics is powerful but not magic, and several challenges deserve attention. Data quality is the biggest: AI trained or run on messy, inconsistent or biased data produces unreliable insights, and it does so confidently, which is more dangerous than an obvious error. Governance and security matter because plain-language access can expose sensitive data to people who should not see it, so access controls and clear data definitions are essential. Trust and explainability are ongoing concerns — a forecast is only useful if decision-makers understand and believe how it was produced.
There are also AI-specific risks. Generative tools can hallucinate — describing a trend that is not in the data or misinterpreting a query — so outputs must be verified, especially for high-stakes decisions. And over-reliance is a real danger: AI is a powerful assistant for analysis, but treating its output as automatically correct, without human review of the logic and the data, invites costly mistakes. The organizations that succeed pair AI’s speed with human oversight, strong data governance, and a culture of questioning results rather than blindly trusting them.
A subtler challenge is skills and adoption. Putting a natural-language analytics tool in front of staff does not automatically make them data-literate; people still need to know which questions are meaningful, how to interpret a forecast’s uncertainty, and when a result is too good to be true. Without basic data literacy, easy access can actually increase the risk of confident misreadings — someone pulls a chart, draws the wrong conclusion, and acts on it. The most successful AI-analytics rollouts therefore pair the technology with training, clear metric definitions, and a governance layer that everyone trusts, so that democratized access leads to better decisions rather than more confident mistakes. Technology is only half the equation; the culture and skills around it are the other half.
9. Frequently Asked Questions
What is AI in analytics?
AI in analytics is the use of artificial intelligence and machine learning to analyze data — automating insight discovery, predicting outcomes, and letting users query data in plain language. Often called augmented analytics, it powers modern BI tools and turns raw data into forecasts, anomaly alerts and recommendations without requiring specialized technical skills.
What are the best AI analytics tools?
The leading AI-powered analytics tools are Microsoft Power BI with Copilot, Tableau with Tableau AI and Pulse, Google Looker powered by Gemini, ThoughtSpot for search-style analytics, and Amazon QuickSight on AWS. Lightweight AI-native tools like Julius AI let you chat directly with a spreadsheet. The best choice depends on your existing stack and team.
How is AI used in data analysis?
AI is used to automate data cleaning and reporting, answer plain-language questions, detect anomalies, segment customers, analyze sentiment, and forecast future outcomes. It moves analytics from describing what happened to predicting what will happen and recommending what to do, making analysis faster and accessible to non-technical users.
Will AI replace data analysts?
AI is automating routine analyst work like data cleaning, reporting and basic queries, but it is not replacing analysts. The human role is shifting toward deciding which questions to ask, judging whether AI output is trustworthy, providing business context, and connecting analysis to decisions. Analysts who use AI tools become more valuable, not obsolete.
What is augmented analytics?
Augmented analytics is the use of AI and machine learning to automate and enhance business intelligence and data analysis — generating insights, detecting patterns, enabling natural-language queries and producing forecasts automatically. It is the industry term for the AI-powered evolution of traditional BI, acting like a tireless data scientist embedded in your tools.
What is the difference between AI analytics and business intelligence?
Traditional business intelligence reports what happened through dashboards and requires technical skill to query. AI analytics is proactive and forward-looking — it surfaces insights automatically, allows plain-language queries, predicts future outcomes, and recommends actions. In practice the two are merging, as every major BI platform now embeds AI capabilities.
Do I need coding skills to use AI analytics tools?
Increasingly, no. Modern AI analytics tools let you ask questions in plain language and get charts, forecasts and insights without SQL or programming. This is a major part of their value — democratizing data so marketers, managers and founders can analyze data themselves. Technical skills still help for complex or custom analysis.
Is AI analytics worth the investment?
For most organizations, yes. Data-driven companies are 23 times more likely to acquire customers and 19 times more likely to be profitable, and BI delivers around 112% average ROI. AI extends these benefits by making analysis faster and more accessible. The key is investing in clean, governed data first, since AI amplifies both good data and bad.
10. Conclusion & Key Takeaways
AI and analytics is reshaping how organizations turn data into decisions — automating the grind, democratizing access through plain language, and shifting analytics from describing the past to predicting and prescribing the future. The leading tools are the BI platforms you may already use, now supercharged with AI, alongside nimble AI-native challengers. The winners will be the organizations that pair AI’s speed with clean data and human judgment, treating AI as a powerful analyst to direct rather than an oracle to obey. To go further, explore our guides to AI tools for data analysis, generative AI, and the best AI tools for business.
- AI and analytics (augmented analytics) automates insights, enables plain-language queries, and adds prediction and prescription to BI.
- Leading tools: Power BI Copilot, Tableau AI, Google Looker, ThoughtSpot and Amazon QuickSight.
- Data-driven organizations are 23x more likely to win customers and 19x more likely to be profitable; BI averages ~112% ROI.
- AI augments analysts rather than replacing them — the job shifts to directing and validating analysis.
- Success depends on clean, governed data and human oversight; AI amplifies both good and bad data.
AI and analytics turns a flood of data into timely, plain-language decisions — but the edge belongs to teams that combine AI’s speed with clean data and sharp human judgment. Start with the tools you already have, govern your data well, and let AI do the heavy lifting.
13 Comments
Pingback: AI in Business Analytics Is Changing How Leaders Decide
Pingback: AI Sentiment Analysis That Reads Emotions Instantly
Pingback: AI Tools for Business Analyst to Work 10x Faster
Pingback: AI Tools for Data Analysis That Save Hours Daily
Pingback: Will AI Take Over Data Analytics – Truth Revealed
Pingback: Using AI for Data Analysis – A Practical Step-by-Step
Pingback: Best AI Tools for Business to Scale Without Extra Staff
Pingback: BI and AI Together Will Transform Your Business Forever
Pingback: Big Data AI – How It Works & Why Your Business Needs It
Pingback: Data Analyst AI – Smarter Decisions Without the Guesswork
Pingback: Why is Generative AI Important – And Why You Should Care
Pingback: Agentic AI Applications: Real-World Use Cases
Pingback: Best AI Tools for Excel (and How to Use Them Well)