


How AI in business analytics works — the applications, benefits and challenges of using AI to turn business data into faster, smarter decisions, with stats and how to start.
| 46% Use AI for Analytics (Top Use Case) | 80%+ Enterprises Deploying GenAI | $785B Data Analytics Market by 2035 | 26–55% Productivity Gains | #1 AI Business Use Case |
| Quick answer: AI in business analytics is the use of machine learning and generative AI to analyze business data and support decisions — automating reporting, predicting outcomes, recommending actions and letting anyone query data in plain language. It’s the single most common AI use case in business, with 46% of companies using AI for analytics and reporting, because it turns slow, manual analysis into fast, conversational insight that improves decisions across marketing, operations and strategy. |
Key Takeaways
- AI in business analytics uses machine learning and generative AI to automate reporting, forecast outcomes, recommend actions, and answer plain-language questions about data.
- It’s the #1 AI use case in business — 46% of companies use AI for analytics and reporting, ahead of customer support and content creation.
- Benefits are measurable: companies report 26–55% productivity gains where AI is deployed, plus faster decisions and democratized access to insights via conversational analytics.
- Challenges remain real: data quality, governance, accuracy and the gap between pilots and full integration determine whether AI analytics delivers value or just experiments.
Table of Contents
1. What Is AI in Business Analytics?
AI in business analytics is the application of machine learning, natural language processing and generative AI to business data in order to support better, faster decisions. Where traditional analytics relied on analysts manually building reports and dashboards, AI automates the heavy lifting — surfacing patterns, predicting outcomes, recommending actions, and letting non-technical users ask questions of their data in plain English.
The significance is hard to overstate: analytics and reporting is the single most common AI use case in business, with 46% of companies using AI for it — ahead of customer support, content creation and sales. This guide explains how AI is reshaping the discipline, its main applications, the measurable benefits and the real challenges. It sits within our pillar on AI and analytics, and connects to the practical side in our guide on using AI for data analysis.
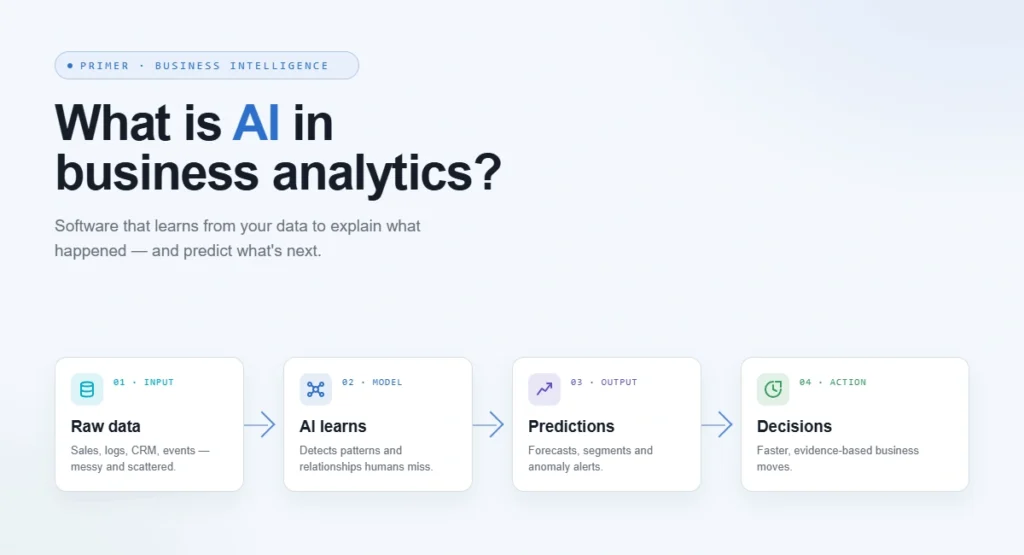
Figure 2: The four levels of analytics, from descriptive to prescriptive
2. How AI Is Transforming Analytics
Analytics traditionally climbs four levels: descriptive (what happened), diagnostic (why), predictive (what will happen) and prescriptive (what to do). AI accelerates every level and, crucially, makes the higher, more valuable levels — prediction and recommendation — accessible to ordinary businesses rather than only data-science teams. Forecasting, anomaly detection and scenario modeling that once needed specialists are increasingly built in.
The biggest shift is conversational analytics. Gartner forecasts that over 80% of enterprises will deploy generative AI applications, with conversational analytics among the highest-adoption use cases, and BARC’s trend monitor ranks natural-language interfaces as a top priority for analyst productivity. Modern systems understand domain jargon — mapping “blended CAC” or “same-store sales” to the right formula automatically — maintain context across multi-turn dialogues, and learn an organization’s own metric definitions through usage. The result is that asking “why did revenue dip in the Midwest last quarter?” in plain language now returns an analyzed answer, not a ticket to the data team.
Generative AI added a second shift: the move from charts to narrative. Where older analytics handed you a dashboard and left interpretation to you, modern AI can write the explanation — summarizing what changed, why it likely happened, and what to consider next, in clear prose. This matters because most decision-makers don’t want to read a chart; they want the takeaway. By turning numbers into language, AI closes the long-standing gap between producing analysis and actually communicating it, which is often where insight died in traditional reporting workflows. The combination of conversational input and narrative output is what makes today’s analytics feel less like software and more like a knowledgeable colleague.
3. Key Applications & Use Cases
AI shows up across the analytics workflow. The most common applications are summarized below.
| Application | What it does |
|---|---|
| Automated reporting | Generates dashboards and narrative summaries automatically |
| Predictive analytics | Forecasts demand, churn, revenue and risk |
| Conversational analytics | Answers plain-language questions about data |
| Anomaly detection | Flags unusual patterns and outliers in real time |
| Prescriptive recommendations | Suggests next-best actions, not just insights |
| Customer & market analytics | Segments, scores and predicts customer behavior |
In practice, automated reporting turns raw data into dashboards and written summaries without manual assembly, while predictive analytics forecasts demand, churn and revenue so teams can act ahead of events rather than react to them. Conversational analytics democratizes access by letting anyone query data in natural language, and anomaly detection continuously watches for outliers — a sudden cost spike, a fraud signal, an operational fault — far faster than periodic human review.
The highest-value application is prescriptive analytics, where AI moves beyond describing what happened to recommending what to do next: which segment to target, which inventory to reorder, which price to set. Across functions, marketing and sales see the strongest revenue impact from these capabilities, while operations, IT and manufacturing capture the clearest cost savings. For the tools that deliver these, see our guides to AI tools for data analysis and the role of the data analyst AI.
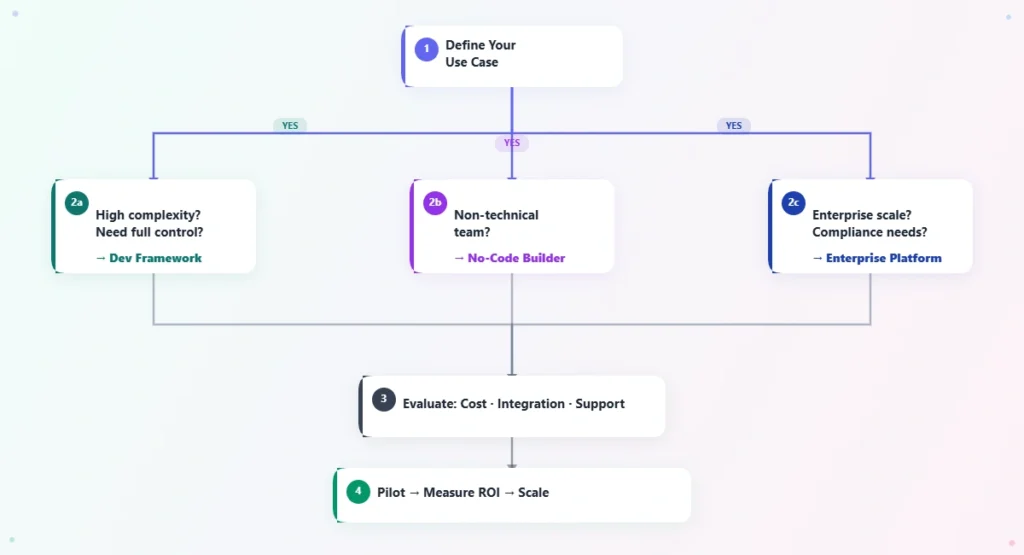
Figure 3: Key AI business-analytics use cases
4. The Benefits (by the Numbers)
The payoff is measurable. Companies report 26–55% productivity gains in functions where AI is deployed, and the average productivity value of generative AI for knowledge workers is estimated at around $7,800 per employee per year. Organizations using AI in IT operations report roughly 31% fewer critical incidents. Speed is a benefit in itself: decisions that once waited days for a report now happen in minutes, and analysts spend their time interpreting rather than assembling data.
Beyond efficiency, AI democratizes insight. When anyone can ask a question in plain language, data-driven decisions stop being the exclusive domain of a small analytics team and spread across the organization. The market reflects this momentum — the broader data analytics market is projected to reach roughly $785 billion by 2035, and over 90% of companies already use AI in some form. The clearest pattern in the 2026 data is that the businesses pulling ahead are those moving from isolated pilots to full integration, treating analytics AI as core infrastructure rather than an experiment.
There’s a competitive dimension worth naming. As AI analytics becomes standard, the advantage shifts from having the technology to using it well — asking sharper questions, acting faster on what it surfaces, and building a culture that trusts and acts on data. In high-adoption sectors the efficiency gap between AI-enabled and lagging competitors accumulates over time rather than staying constant, because faster, better decisions compound. That makes business analytics one of the areas where falling behind is most costly: a rival that decides a week faster on pricing, inventory or marketing, every week, pulls steadily ahead in ways that are hard to claw back.
5. Challenges & Limitations
The benefits are real, but so are the obstacles. Data quality is the foundation — AI analytics amplifies whatever it’s fed, so messy, siloed or inconsistent data produces confident but wrong answers. Indeed, data quality consistently ranks as the top priority and barrier ahead of even AI interfaces themselves. Governance and trust matter too: leaders need to know how a conclusion was reached before acting on it, and conversational tools can occasionally misinterpret a question or hallucinate a figure.
The other major gap is organizational. The 2026 research is clear that pilots and partial adoption do not produce the same outcomes as full integration — many companies are stuck at efficiency improvements and isolated use cases, while a smaller group turns AI into measurable financial results. Realizing value requires treating productivity, cost and revenue as distinct stages, prioritizing workflows with proven gains, and building outward from there. Skills and change management round out the challenge: tools are only as good as the teams interpreting their output. These themes run through our guide to whether AI will take over data analytics.
It’s also worth being honest about the limits of automation in decision-making. AI excels at finding patterns and forecasting from historical data, but it struggles with genuine novelty — a market shift with no precedent, a one-off event, a strategic judgment call that depends on context the data doesn’t capture. Over-trusting a model in these moments is a real risk, because its confidence doesn’t drop just because the situation is unfamiliar. The mature approach treats AI analytics as a powerful input to human judgment rather than a replacement for it, especially for high-stakes, irreversible or unprecedented decisions where being confidently wrong is far costlier than being slow.
| 💡 Pro Tip Before deploying AI analytics, invest in data quality first. The single biggest predictor of success isn’t the sophistication of the AI — it’s the cleanliness and consistency of the data feeding it. Standardize your metric definitions, consolidate key data sources, and fix obvious quality issues before turning on conversational or predictive tools. A modest model on clean data beats a powerful one on messy data every time. |
6. Getting Started
Start where the value is easiest to prove. Identify a structured, repetitive workflow — weekly sales reporting, demand forecasting, churn prediction — where time savings and output gains are simple to measure, and deploy AI there first. Measure the operational gain, then track whether it improves a business result leadership already cares about: margin, speed to market, conversion or retention. This staged approach separates experimental use cases from operational ones and prevents surface-level adoption from being mistaken for strategic progress.
Practically, that means cleaning and consolidating the relevant data, choosing tools that fit your stack (many modern BI platforms now embed conversational and predictive AI), and upskilling the people who’ll interpret the output. Begin with one high-fit use case, prove the result, and expand outward. Pair this with our guides to BI and AI for the platform side and the best AI tools for business for the wider stack. Used this way, AI in business analytics becomes a compounding advantage rather than a one-off experiment.
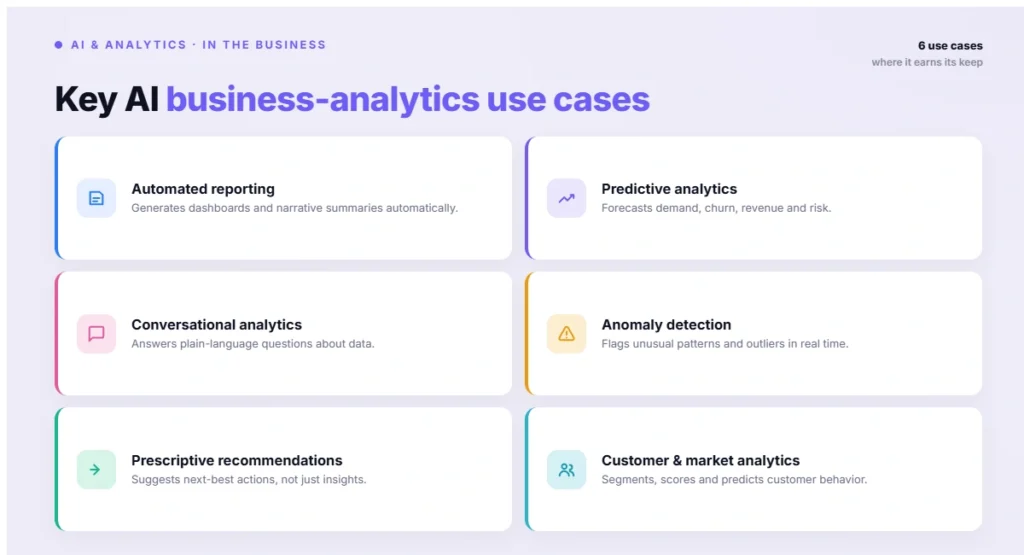
Figure 4: Benefits weighed against challenges
| ⚠️ Important AI analytics is only as trustworthy as its data and governance. Conversational and predictive tools can confidently produce wrong answers when fed messy or siloed data, and acting on an unverified AI conclusion can be costly. Always validate critical insights, keep a human reviewing high-stakes decisions, and ensure you can trace how an AI reached a conclusion before you act on it. |
7. Frequently Asked Questions
What is AI in business analytics?
AI in business analytics is the use of machine learning, natural language processing and generative AI to analyze business data and support decisions. It automates reporting, forecasts outcomes, detects anomalies, recommends actions, and lets non-technical users query data in plain language — turning slow manual analysis into fast, conversational insight across the organization.
How common is AI in business analytics?
Very common — analytics and reporting is the single most common AI use case in business, with 46% of companies using AI for it, ahead of customer support and content creation. More broadly, over 90% of companies use AI in some form, and Gartner forecasts that 80%+ of enterprises will deploy generative AI applications, with conversational analytics among the highest-adoption uses.
What are the main benefits of AI in business analytics?
The main benefits are speed, productivity and democratized access. Companies report 26–55% productivity gains where AI is deployed, decisions that once took days happen in minutes, and conversational interfaces let anyone query data without technical skills. AI also enables predictive and prescriptive analytics — forecasting outcomes and recommending actions — not just describing what happened.
What are the four types of business analytics?
The four types are descriptive (what happened), diagnostic (why it happened), predictive (what will happen) and prescriptive (what to do about it). AI accelerates all four and makes the higher-value predictive and prescriptive levels accessible to ordinary businesses, not just data-science teams — which is the core of its transformative impact on analytics.
What is conversational analytics?
Conversational analytics lets users ask questions of their data in plain language and get analyzed answers, rather than building reports manually. Modern systems understand domain jargon (mapping terms like “blended CAC” to the right formula), maintain context across multi-turn conversations, and learn an organization’s own metric definitions. Gartner ranks it among the highest-adoption generative AI use cases.
What are the challenges of AI in business analytics?
The biggest challenges are data quality (AI amplifies messy data into confident but wrong answers), governance and trust (knowing how a conclusion was reached), accuracy and occasional hallucination, and the organizational gap between pilots and full integration. Data quality consistently ranks as the top barrier, ahead of even the AI interfaces themselves.
Will AI replace business analysts?
AI is augmenting analysts more than replacing them — it automates report assembly and surfaces insights, freeing analysts to focus on interpretation, judgment and strategy, which AI cannot fully replicate. The skill set is shifting toward asking the right questions and validating AI output rather than manually building dashboards. Our dedicated guide explores this question in depth.
How do I start using AI in business analytics?
Start with one structured, repetitive workflow where time savings are easy to measure — like weekly reporting or demand forecasting. Clean and consolidate the relevant data first, choose tools that fit your existing stack, prove the operational gain, then expand to workflows that affect results leadership cares about. Avoid trying to transform everything at once.
8. Conclusion & Key Takeaways
AI in business analytics has become the leading AI use case in business for a reason: it turns slow, manual analysis into fast, conversational, predictive insight that improves decisions everywhere. The benefits are measurable — 26–55% productivity gains, faster decisions and democratized access — but realizing them depends on clean data, sound governance and moving from pilots to full integration. Start with one high-fit workflow, prove the result, and build outward. Treat data quality as the foundation and keep humans validating high-stakes decisions, and AI analytics becomes a compounding competitive advantage. To go deeper, see our pillar on AI and analytics and the guide on using AI for data analysis.
- AI in business analytics automates reporting, forecasting, anomaly detection, recommendations and plain-language querying.
- It’s the #1 AI use case in business — 46% of companies use AI for analytics and reporting.
- Benefits include 26–55% productivity gains, faster decisions and democratized insight access.
- Data quality, governance and pilot-to-integration gaps are the main challenges.
- Start with one structured, high-value workflow, prove it, then scale.
AI hasn’t just sped up business analytics — it’s changed who gets to use it, turning data from a specialist resource into a question anyone can ask. Start with clean data and one clear workflow, and you’ll turn analytics from a bottleneck into your fastest path to better decisions.
9 Comments
Pingback: AI Sentiment Analysis: Complete Guide 2026 - Techiehub
Pingback: AI and Analytics: The Complete Guide to AI Data
Pingback: AI Sentiment Analysis That Reads Emotions Instantly
Pingback: AI Tools for Data Analysis That Save Hours Daily
Pingback: Will AI Take Over Data Analytics – Truth Revealed
Pingback: Using AI for Data Analysis – A Practical Step-by-Step
Pingback: BI and AI Together Will Transform Your Business Forever
Pingback: Big Data AI – How It Works & Why Your Business Needs It
Pingback: Data Analyst AI – Smarter Decisions Without the Guesswork