


How BI and AI converge — the shift from dashboards to conversations, the core AI capabilities, the major platforms (Power BI, Tableau, ThoughtSpot) and how to choose.
| Copilot At the Heart of Power BI | 3 Core AI Capabilities | $10 Power BI Pro / User / Mo | 62% Poor ROI = Tool Mismatch | →chat Dashboards to Conversations |
| Quick answer: BI and AI are converging as every major business intelligence platform adds an AI layer that turns static dashboards into conversations with data. Three capabilities lead: natural-language querying (ask in plain English, get a chart), automated insight discovery (AI surfaces anomalies you didn’t ask about) and narrative summaries (AI explains trends in words). Power BI Copilot, Tableau Agent and ThoughtSpot lead, but output is only as good as the underlying data model. |
Key Takeaways
- Every major BI platform now has an AI layer — Microsoft put Copilot at the heart of Power BI in 2026, shifting BI from static dashboards to dynamic, on-demand conversations with data.
- Three core capabilities: natural-language querying, automated insight discovery and narrative summaries that explain trends in plain words.
- The leaders differ in approach: Power BI Copilot accelerates report-building, Tableau Agent proactively surfaces insights, and ThoughtSpot is search- and AI-native.
- The ceiling on all of them is the same — output is only as good as the underlying data model, and a 2026 Gartner survey found 62% of poor-ROI cases were tool mismatch, not data quality.
Table of Contents
1. BI and AI: What’s Changing
Business intelligence (BI) — the practice of turning company data into reports and dashboards for decisions — is being reshaped by AI. For years BI ran on a single model: a small number of technical users built governed reports for a much larger audience, who mostly ended up filing a ticket and waiting days for an answer. AI is the most significant attempt yet to close that gap, not by replacing BI but by changing how business teams interact with it.
In 2026, every major BI platform has an AI layer, and Microsoft has positioned Copilot at the heart of Power BI, signaling that the future of BI is AI-powered. This guide explains what AI genuinely adds to BI, the three capabilities that matter, the leading platforms and how to choose. It sits within our pillar on AI and analytics and complements our guide to AI in business analytics.
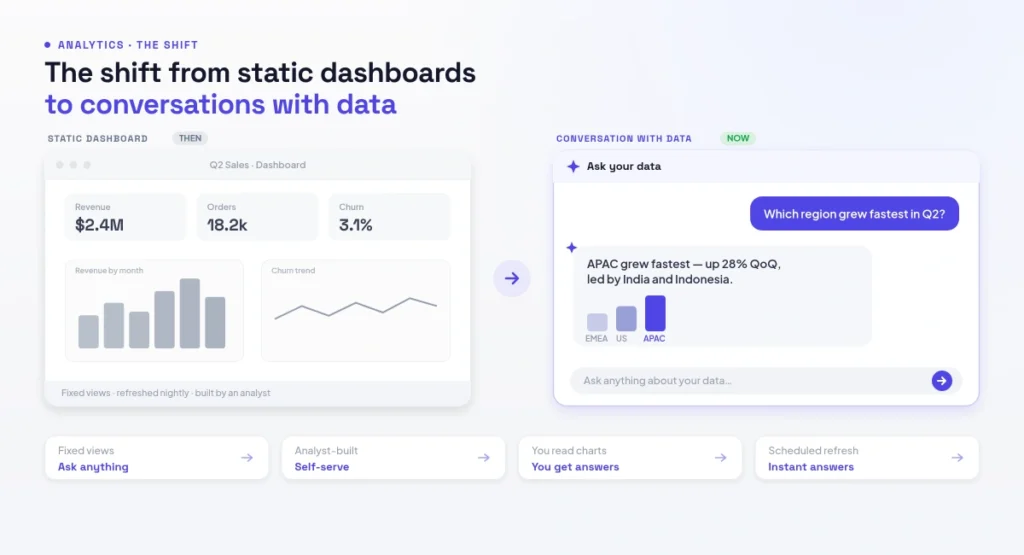
Figure 2: The shift from static dashboards to conversations with data
2. From Dashboards to Conversations
Traditional BI required analysts to manually build every visualization, write every formula and create every report page. AI inverts this model: users describe what they want in plain language, and the platform generates it. Power BI Copilot, for example, can create an entire report page from a prompt like “show monthly revenue by product category,” generate the underlying DAX measures, and add narrative summaries automatically.
This reframes how executives consume analytics — moving from static dashboards toward dynamic, on-demand conversations with data. A CFO no longer waits for a quarterly report; they ask a question and get an analyzed answer in seconds. Microsoft underscored the direction by confirming it will retire Power BI’s older Q&A visual in favor of the conversational Copilot experience. The promise of self-service analytics, made a decade ago but rarely delivered, is finally within reach — though, as we’ll see, only when the data underneath is well modeled.
The cultural change this enables is as important as the technical one. When answers are a question away rather than a ticket away, people ask more questions — and a curious, data-fluent culture is itself a competitive asset. Decisions that previously defaulted to gut feel because the data took too long to retrieve can now be checked in the moment. That said, lowering the barrier also raises the stakes on governance: when everyone can query the data, everyone can also misinterpret it, so the organizations that benefit most pair conversational access with clear metric definitions and light-touch oversight. The goal isn’t just faster answers, but faster correct answers that the whole team can trust.
3. Three Core AI Capabilities in BI
Three AI capabilities are genuinely useful in 2026 BI, summarized below.
| Capability | What it does |
|---|---|
| Natural-language querying | Ask a question in plain English, get a chart, table or summary |
| Automated insight discovery | AI surfaces anomalies and trends you didn’t explicitly ask for |
| Narrative summaries | AI explains what the data shows in plain-language prose |
| Report generation | Builds full report pages and formulas from a description |
| Forecasting & AutoML | Predicts time-series trends and builds simple models |
Natural-language querying is the headline feature — ask “what were our top five products by revenue last quarter?” and get an instant visual answer. Power BI’s Copilot, Tableau’s Ask Data and ThoughtSpot’s Sage all translate plain-language intent into a query against the governed data model. Automated insight discovery goes further, proactively flagging anomalies and patterns a user never thought to look for — a sudden regional dip, an unusual cost spike — shifting BI from reactive to proactive.
Narrative summaries close the communication gap: instead of leaving you to interpret a chart, the AI writes the takeaway in plain prose, which is what most decision-makers actually want. Rounding these out are report generation (building full pages and formulas from a description) and forecasting and AutoML for time-series prediction. Together they democratize capabilities that once required a data scientist — though forecasting remains limited to time-series rather than complex multivariate prediction. For the broader toolset, see our guide to AI tools for data analysis.
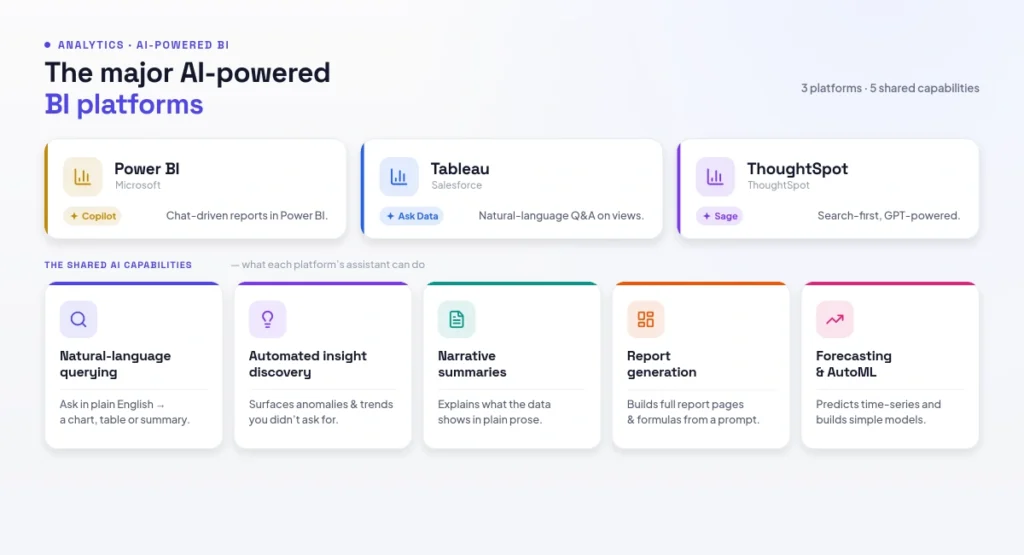
Figure 3: The major AI-powered BI platforms
4. The Major AI-Powered BI Platforms
Three platforms lead, each with a distinct strategy. Microsoft Power BI dominates Microsoft-centric enterprises (over 30% of the North American BI market) with a low $10/user/month entry point and deep Copilot integration across Excel, Teams and Power BI — though advanced Copilot features require Premium Per User (~$20/user/month) or Fabric capacity, which can be expensive for small teams. Tableau leads on advanced visualization and, since its Salesforce acquisition, has leaned into agentic analytics with Tableau Next and Tableau Agent, connecting AI agents to the Salesforce ecosystem.
ThoughtSpot represents the AI-native camp — built around search and conversational interaction from the ground up rather than retrofitting AI onto dashboards, with agents like SpotterViz that build dashboards automatically and SpotterModel that creates semantic models with human-in-the-loop validation. Beyond these, augmented BI tools like Tableau with Einstein add AI to familiar interfaces, while AI-native platforms prioritize speed-to-answer over breadth of visualization. Vertical tools serve specific industries — Health Catalyst for healthcare, Alteryx for financial risk modeling. The right pick depends on your existing stack: already on Microsoft 365 points to Power BI; on Salesforce points to Tableau; wanting maximum self-service points to an AI-native platform. These connect to the wider best AI tools for business.
A useful distinction when evaluating platforms is “retrofit” versus “native.” Retrofit platforms — the established BI giants — bolt AI onto a mature, deeply-featured product, so you get powerful visualization and governance with an AI layer that’s still maturing. Native platforms start from the AI interaction and build outward, so they feel more natural to query conversationally but may lack the depth of visualization options or enterprise governance that large organizations require. Neither is universally better: a Fortune 500 with strict governance needs may prefer a retrofit giant, while a fast-moving team that wants every employee asking questions of data may get more value from a native platform. Knowing which trade-off you’re making prevents disappointment after rollout.
5. Copilots vs Agents (and How to Choose)
The most visible AI additions split into two modes. Copilots assist while keeping the analyst in control — Power BI Copilot generates DAX in the query view and builds reports faster, responding to “create this chart for me.” Agents act more independently, surfacing insights you didn’t ask for: Tableau Agent flags “here is an anomaly in your sales data” without a prompt, and ThoughtSpot’s agents build dashboards and models autonomously. The simplest framing: Copilots are about productivity acceleration, agents about proactive monitoring.
Choosing between them depends on what your team needs. If the bottleneck is building reports fast, a Copilot-first platform like Power BI fits. If you want the system to watch your data and alert you to issues without being asked, an agentic approach like Tableau Agent or an AI-native platform fits. Crucially, a 2026 Gartner survey found that 62% of organizations reporting poor analytics ROI blamed tool mismatch, not data quality — so the question is never “which tool is best” but “which is best for us,” fitting your people, data stack and objectives. This mirrors the agentic shift covered in our guide to the best AI agent tools.
6. Limitations & Best Practices
The single most important limitation: AI output is only as good as the underlying data model. Natural-language accuracy depends heavily on well-modeled data with clear naming conventions; feed Copilot or Ask Data a messy, poorly-named model and it produces confident but wrong answers. Copilots can also hallucinate or generate incorrect formulas, forecasting is limited to time-series, and the most capable features sit behind premium licensing that’s costly for small teams.
To get value, invest first in a clean, well-named, governed data model — it’s the foundation every AI feature stands on. Keep a human reviewing AI-generated formulas and high-stakes conclusions, since plausible-looking DAX or a confident narrative can still be wrong. Match the platform to your existing ecosystem rather than chasing features, and roll out conversational access gradually so business users learn to trust and verify the answers. Treat AI as a way to reach the people self-service BI always promised to serve — but only after the data underneath is sound. For the human side of this transition, see our guides to the data analyst AI and AI tools for business analyst.
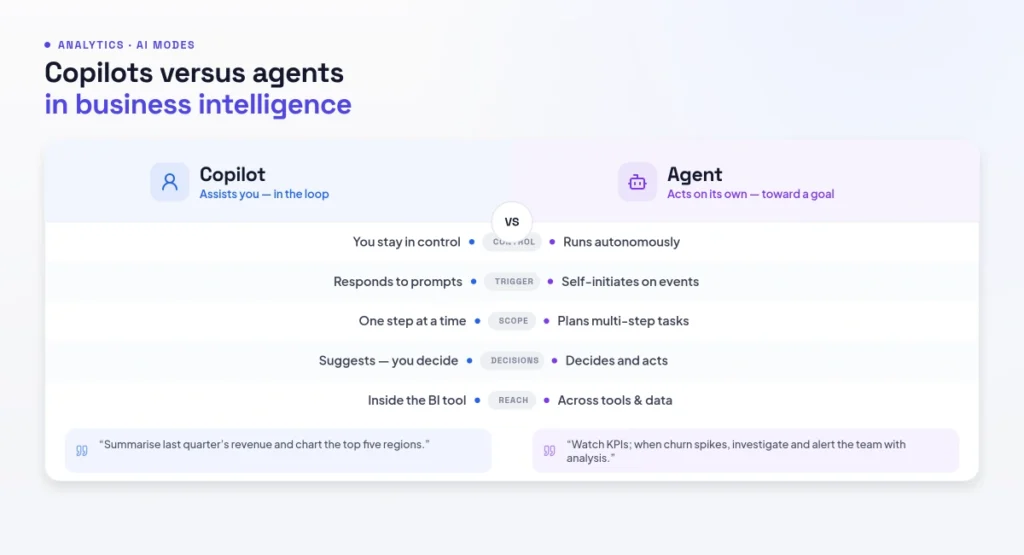
Figure 4: Copilots versus agents in business intelligence
| ⚠️ Important AI-powered BI inherits the quality of your data model. Natural-language queries and Copilots produce confident but wrong answers when the underlying model is messy or poorly named, and AI can hallucinate incorrect formulas. Never act on an AI-generated insight or DAX measure for a high-stakes decision without verifying it, and invest in clean, well-governed data before rolling conversational analytics out to business users. |
7. Frequently Asked Questions
How are BI and AI related?
AI is now embedded in every major business intelligence platform, transforming how teams interact with data. Instead of analysts manually building dashboards and others waiting for reports, AI lets users ask questions in plain language, surfaces insights automatically, and writes narrative explanations. It doesn’t replace BI — it changes the interface, moving from static dashboards to dynamic conversations with data.
What is augmented analytics in BI?
Augmented analytics is BI enhanced with AI capabilities layered onto familiar dashboard interfaces — natural-language querying, automated insight discovery and narrative summaries. Tools like Power BI Copilot, Tableau with Einstein and ThoughtSpot let non-technical users ask questions and get instant visual answers, democratizing analytics access without rebuilding the underlying data infrastructure.
What is the best AI-powered BI tool?
It depends on your stack. Power BI leads for Microsoft-centric organizations at $10/user/month with deep Copilot integration; Tableau leads on visualization and agentic analytics, especially for Salesforce users; and ThoughtSpot is the strongest AI-native, search-first option. A 2026 Gartner survey found most poor-ROI cases were tool mismatch, so choose by fit, not feature count.
What is the difference between a Copilot and an agent in BI?
A Copilot assists while keeping the analyst in control — it builds reports and writes formulas in response to prompts, accelerating productivity. An agent acts more independently, proactively surfacing anomalies and insights you didn’t ask for and even building dashboards autonomously. Power BI Copilot focuses on acceleration; Tableau Agent and ThoughtSpot’s agents focus on proactive monitoring.
Can AI in BI replace data analysts?
Not entirely. AI automates report-building and surfaces insights, but it depends on well-modeled data, can hallucinate formulas, and needs human judgment for high-stakes decisions. Analysts are shifting toward data modeling, governance, asking the right questions and validating AI output. The role evolves rather than disappears, with AI handling the repetitive assembly work.
How much does AI-powered BI cost?
Power BI Pro starts at about $10/user/month, but Copilot’s advanced AI requires Premium Per User (~$20/user/month) or Fabric capacity. Tableau Agent requires Tableau+ licensing on top of the base Creator/Explorer cost. AI-native platforms price separately. Advanced AI features generally cost more, which can be a barrier for small teams.
What are the limitations of AI in business intelligence?
The main limitations are that output is only as good as the underlying data model, natural-language accuracy depends on clean naming conventions, Copilots can hallucinate incorrect formulas, forecasting is limited to time-series rather than multivariate prediction, and advanced features sit behind expensive premium licensing. Clean, governed data and human verification remain essential.
How do I choose an AI BI platform?
Match the platform to your existing ecosystem and needs, not the longest feature list. If you’re on Microsoft 365, Power BI’s Copilot integration and low cost fit; if you’re on Salesforce, Tableau Agent fits; if you want maximum self-service for non-technical users, an AI-native platform like ThoughtSpot fits. Gartner found tool mismatch, not data quality, drives most poor-ROI outcomes.
8. Conclusion & Key Takeaways
The convergence of BI and AI is finally delivering the self-service analytics that dashboards promised a decade ago — but through conversation rather than configuration. Natural-language querying, automated insight discovery and narrative summaries let anyone ask questions of their data, while Copilots accelerate report-building and agents proactively monitor for issues. Power BI, Tableau and ThoughtSpot lead with different strategies, so choose by fit with your stack rather than feature count. Above all, remember that every AI feature stands on the data model beneath it: invest in clean, governed data and keep humans verifying high-stakes outputs. To go deeper, see our pillar on AI and analytics and the guide to AI in business analytics.
- Every major BI platform now has an AI layer, shifting BI from static dashboards to conversations.
- Three core capabilities: natural-language querying, automated insight discovery, narrative summaries.
- Power BI Copilot accelerates report-building; Tableau Agent and ThoughtSpot proactively surface insights.
- Output is only as good as the data model; 62% of poor-ROI cases were tool mismatch, not data quality.
- Invest in clean, governed data and verify high-stakes AI outputs before acting.
AI hasn’t replaced business intelligence — it’s finally made it usable by everyone, turning the dashboard you used to wait for into a conversation you can have right now. Get your data model right, choose the platform that fits your world, and BI becomes a tool your whole team actually uses.
8 Comments
Pingback: AI and Analytics Guide for Smarter Business Growth
Pingback: AI and Analytics: The Complete Guide to AI Data
Pingback: AI in Business Analytics Is Changing How Leaders Decide
Pingback: Best AI Sales Forecasting Tools to Predict Revenue
Pingback: AI Tools for Business Analyst to Work 10x Faster
Pingback: AI Tools for Data Analysis That Save Hours Daily
Pingback: Will AI Take Over Data Analytics – Truth Revealed
Pingback: Big Data AI – How It Works & Why Your Business Needs It